Video: .mp4 (1280x720, 30 fps(r)) | Audio: aac, 44100 Hz, 2ch | Size: 22.3 GB
Genre: eLearning Video | Duration: 636 lectures (46 hours, 7 mins) | Language: English
Office 365:MS Excel,Excel Dashboard,PivotTables,Power Query,Power Pivot,Power Map,What-If-Analysis,Formulas,Charts.
What you'll learn Homepage:
Learn all basic concepts of excel
Learn most commonly used formulas in the office
Learn PivotTables and PivotCharts
Learn Power Query
Learn Power Pivot
Learn Power Map
Learn What-if-analysis Tools
Learn Forecasting Sheet
Learn Excel Formulas and Functions
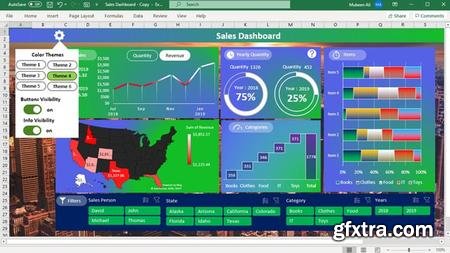
Create Excel Dashboards
And Much More!
Create reports in power bi
Create dashboards in power bi
Visualize data in power bi
Edit data in power bi and power query editor
Add buttons in report page
Visualize data in power bi by adding custom visuals
Requirements
This course is recorded on excel 2019 but all previous versions 2007,2010,2013,2016 and office 365 will work on this course.
Download free Microsoft Power BI.
Description
This course covers training for two Microsoft apps.Microsoft Excel and Microsoft Power BI.These two apps are very useful in the office and business world.
Microsoft Excel/Office 365
Learn pivottables ,pivotcharts,power query,power pivot,power map,what-if-analysis tools,solver and others topics.Learn how to add charts in Microsoft Excel sheet.Learn how to use formulas and functions in Microsoft Excel.Learn how to create dashboards in Excel.To see more topics of this course,view course contents in the course landing page.
Microsoft Power BI/Office 365
Learn How to Analyze Data in Microsoft Business Intelligence Power BI.How to Reports and Dashboards are Created in Power BI.
In this course,you will learn,how to analyze business data in Microsoft business intelligence power bi.You will learn how to extract data from the website and an other sources and how that data is transformed in power query editor and power bi.You will learn how to that data is visualized in power bi.You will learn how to create reports and dashboards in power bi and how to add buttons in report page.You will learn how to custom visuals are added and data is visualized from that visuals.And much more!
Who this course is for:
If someone want to learn excel from basic to Advance,this course covers basic and advance levels topics.
If someone want to learn business intelligence for data analysis and for creating dashboards and reports,learn Microsoft power BI from basic to advance levels.

TO MAC USERS: If RAR password doesn't work, use this archive program:
RAR Expander 0.8.5 Beta 4 and extract password protected files without error.
TO WIN USERS: If RAR password doesn't work, use this archive program:
Latest Winrar and extract password protected files without error.
SermonBox - Seasonal Collection

SermonBox - The Series Pack Collection

Top Rated News


Would you like to be a Author?